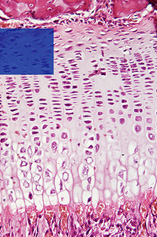
1 – The zone of resting cartilage is placed next to the bone of the epiphysis. It has the typical appearance of a hyaline cartilage, formed by chondrocytes (highlighted in red) surrounded by a bluish ECM (highlighted in a dark tone of blue). The bone is the reddish band at the top of the figure (not highlighted when using the mouse or clicking on the image). Osteocytes can be seen surrounded by a red/pink extracellular matrix.
2 – Zone of serial cartilage. The chondrocytes of this zone (highlighted in red) divide actively by mitosis and become organized in rows, like stacks of coins. The cartilaginous matrix is highlighted in light tone of blue.
As a result of the proliferation of chondrocytes in the serial cartilage, their daughter cells accumulate in the end of this region. The continuous accumulation of new chondrocytes “pushes” the epiphyses away from the diaphysis, resulting in the longitudinal growth of the bone.